OVERVIEW Overview
OVERVIEW Overview of Hachinohe Port
Port management body | Aomori Prefecture |
|---|---|
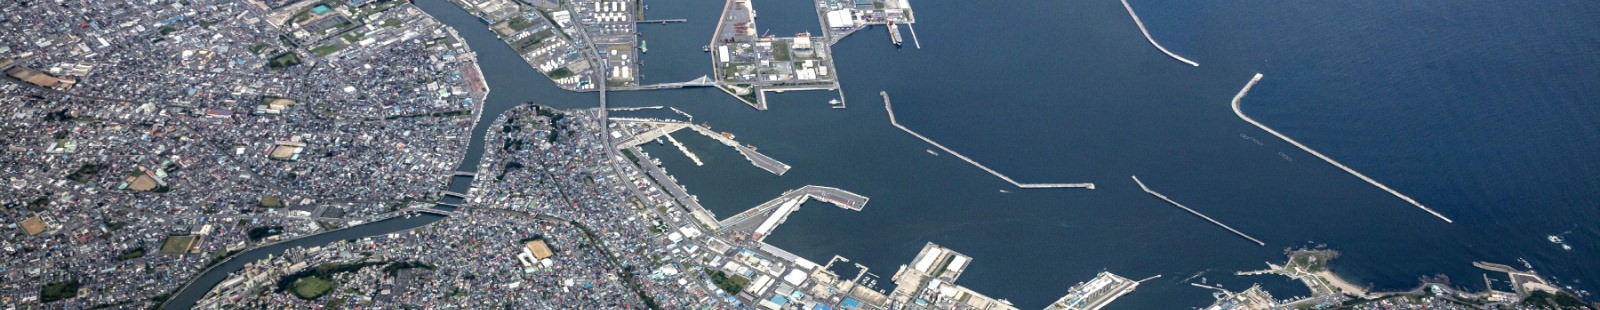
Location | Located in the southeastern part of Aomori Prefecture on the northern edge of Honshu Island (latitude: 40° 30' north; longitude: 141° 30' east), Hachinohe Port faces the Pacific Ocean. |
Geological conditions | Alluvial formed by the accumulation of sand sediment transported by the Mabechi River and the Niida River. The soil is assumed to be firm since the sediment contains hardly any peat. |
Currents | Three currents meet here: the Kuroshio Current (flowing from south to north), the Oyashio Current (flowing south along the Chishima Islands), and the Japan Warm Current (flowing through Tsugaru Strait). Near the coast, the currents generally flow from northeast to southwest at full tide and from southeast to northwest at low tide. The current speed is 0.15 knots or less. |
Wind direction and speed | The winds are mostly onshore breezes that blow from the northeast or east during the summer, and offshore breezes that blow from the west-southwest or west during the winter. The annual average wind speed is about 4 m/s. |
Port area | The sea surface area surrounded by a 370-m line drawn at an angle of 18° 41' from a point located at a distance of 1,329 m at an angle of 26° from Shimo-Otani Sankakuten (15.51 m) (latitude: 40° 34' 29'' north; longitude 141° 28' 02'' east), a 2,200-m line drawn from the point at an angle of 90°, a 3,960-m line drawn from the point at an angle of 122° 50', a line between the point and Hinode Rock (3.3 m), and a line drawn from the rock at an angle of 180° as well as the surface area of the Niida River downstream of the Minato Bridge and Old Mabechi River downstream of the closing levee of the Mabechi River. |
STATISTICS Statistics
Annual inbound and outbound marine cargo (2020)
Source: "Hachinohe Port Annual Statistics Report" published by Aomori Prefecture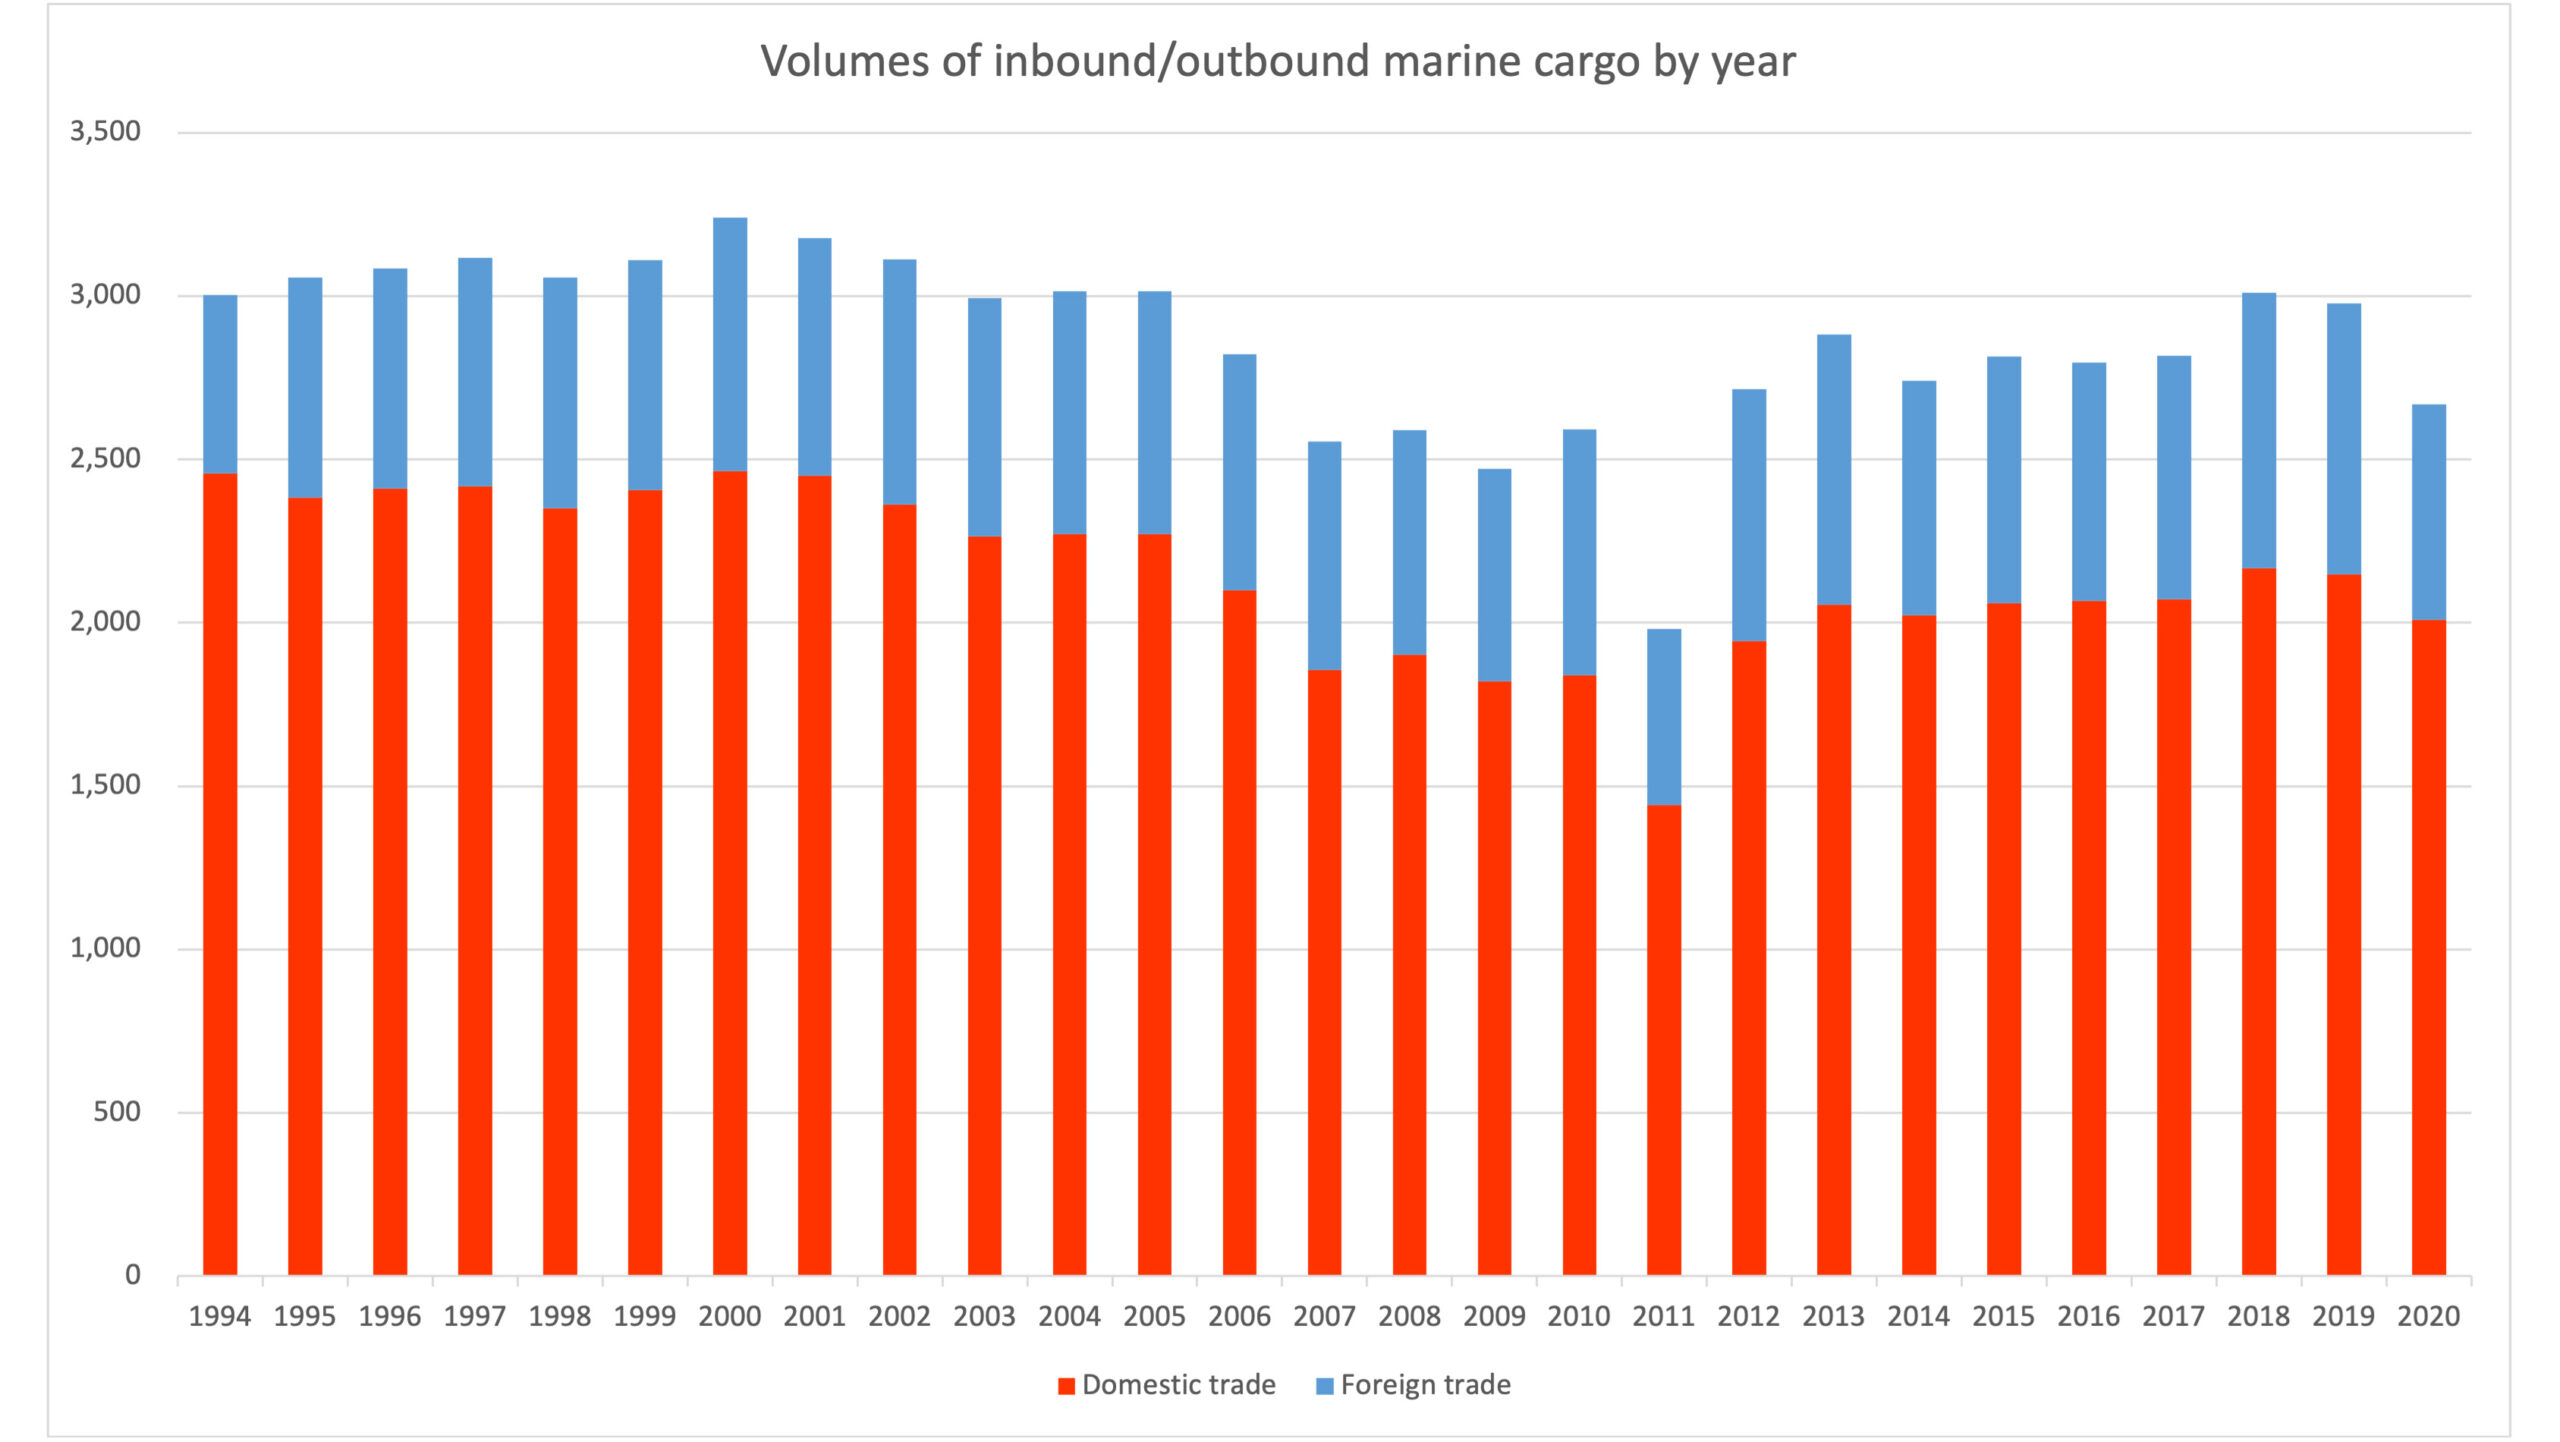
YoY comparison of inbound and outbound marine cargo (2019–2020)
Source: "Hachinohe Port Annual Statistics Report" published by Aomori Prefecture Unit: 10,000 tons| Ocean-going vessels | Inland vessels | Total | |||||
|---|---|---|---|---|---|---|---|
| Category | Export | Import | Total | Outbound | Inbound | Total | |
| 2019 | 499,090 | 7,785,958 | 8,285,048 | 11,282,793 | 10,204,888 | 21,487,681 | 29,772,729 |
| 2020 | 455,379 | 6,144,037 | 6,599,416 | 10,461,834 | 9,637,445 | 20,099,279 | 26,698,695 |
| YoY comparison | 91.2% | 78.9% | 79.6% | 92.7% | 94.4% | 93.5% | 89.6% |
Main inbound and outbound products (2020)
Source: "Hachinohe Port Annual Statistics Report" published by Aomori Prefecture Unit: %
Main export and import products (2020)
Source: "Hachinohe Port Annual Statistics Report" published by Aomori Prefecture Unit: %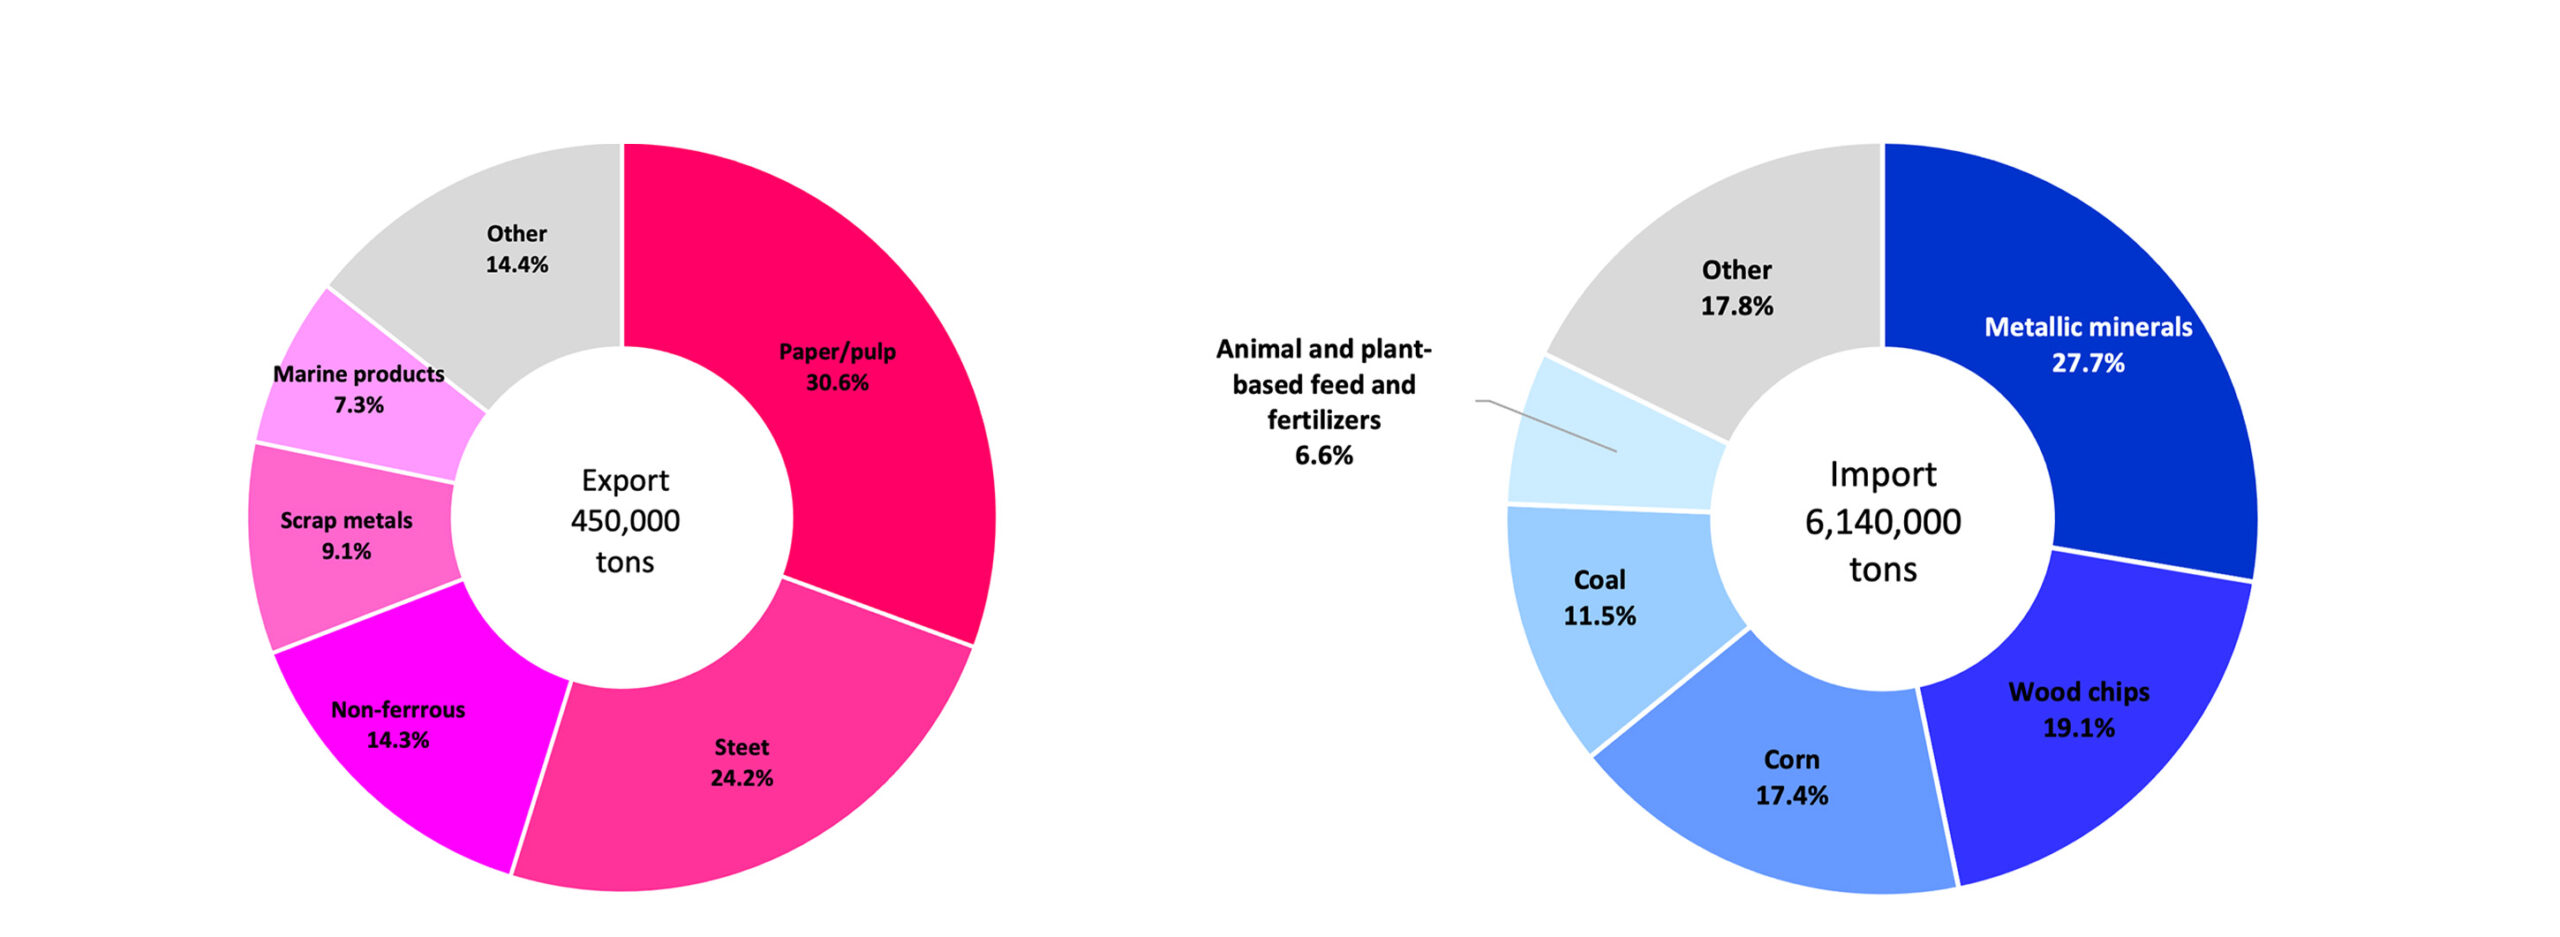
CONTAINER STATUS Status of container handling at Hachinohe Port
Container handling results by route (including empty containers) (2021)
Author: Hachinohe Port Logistics Globalization Promotion Council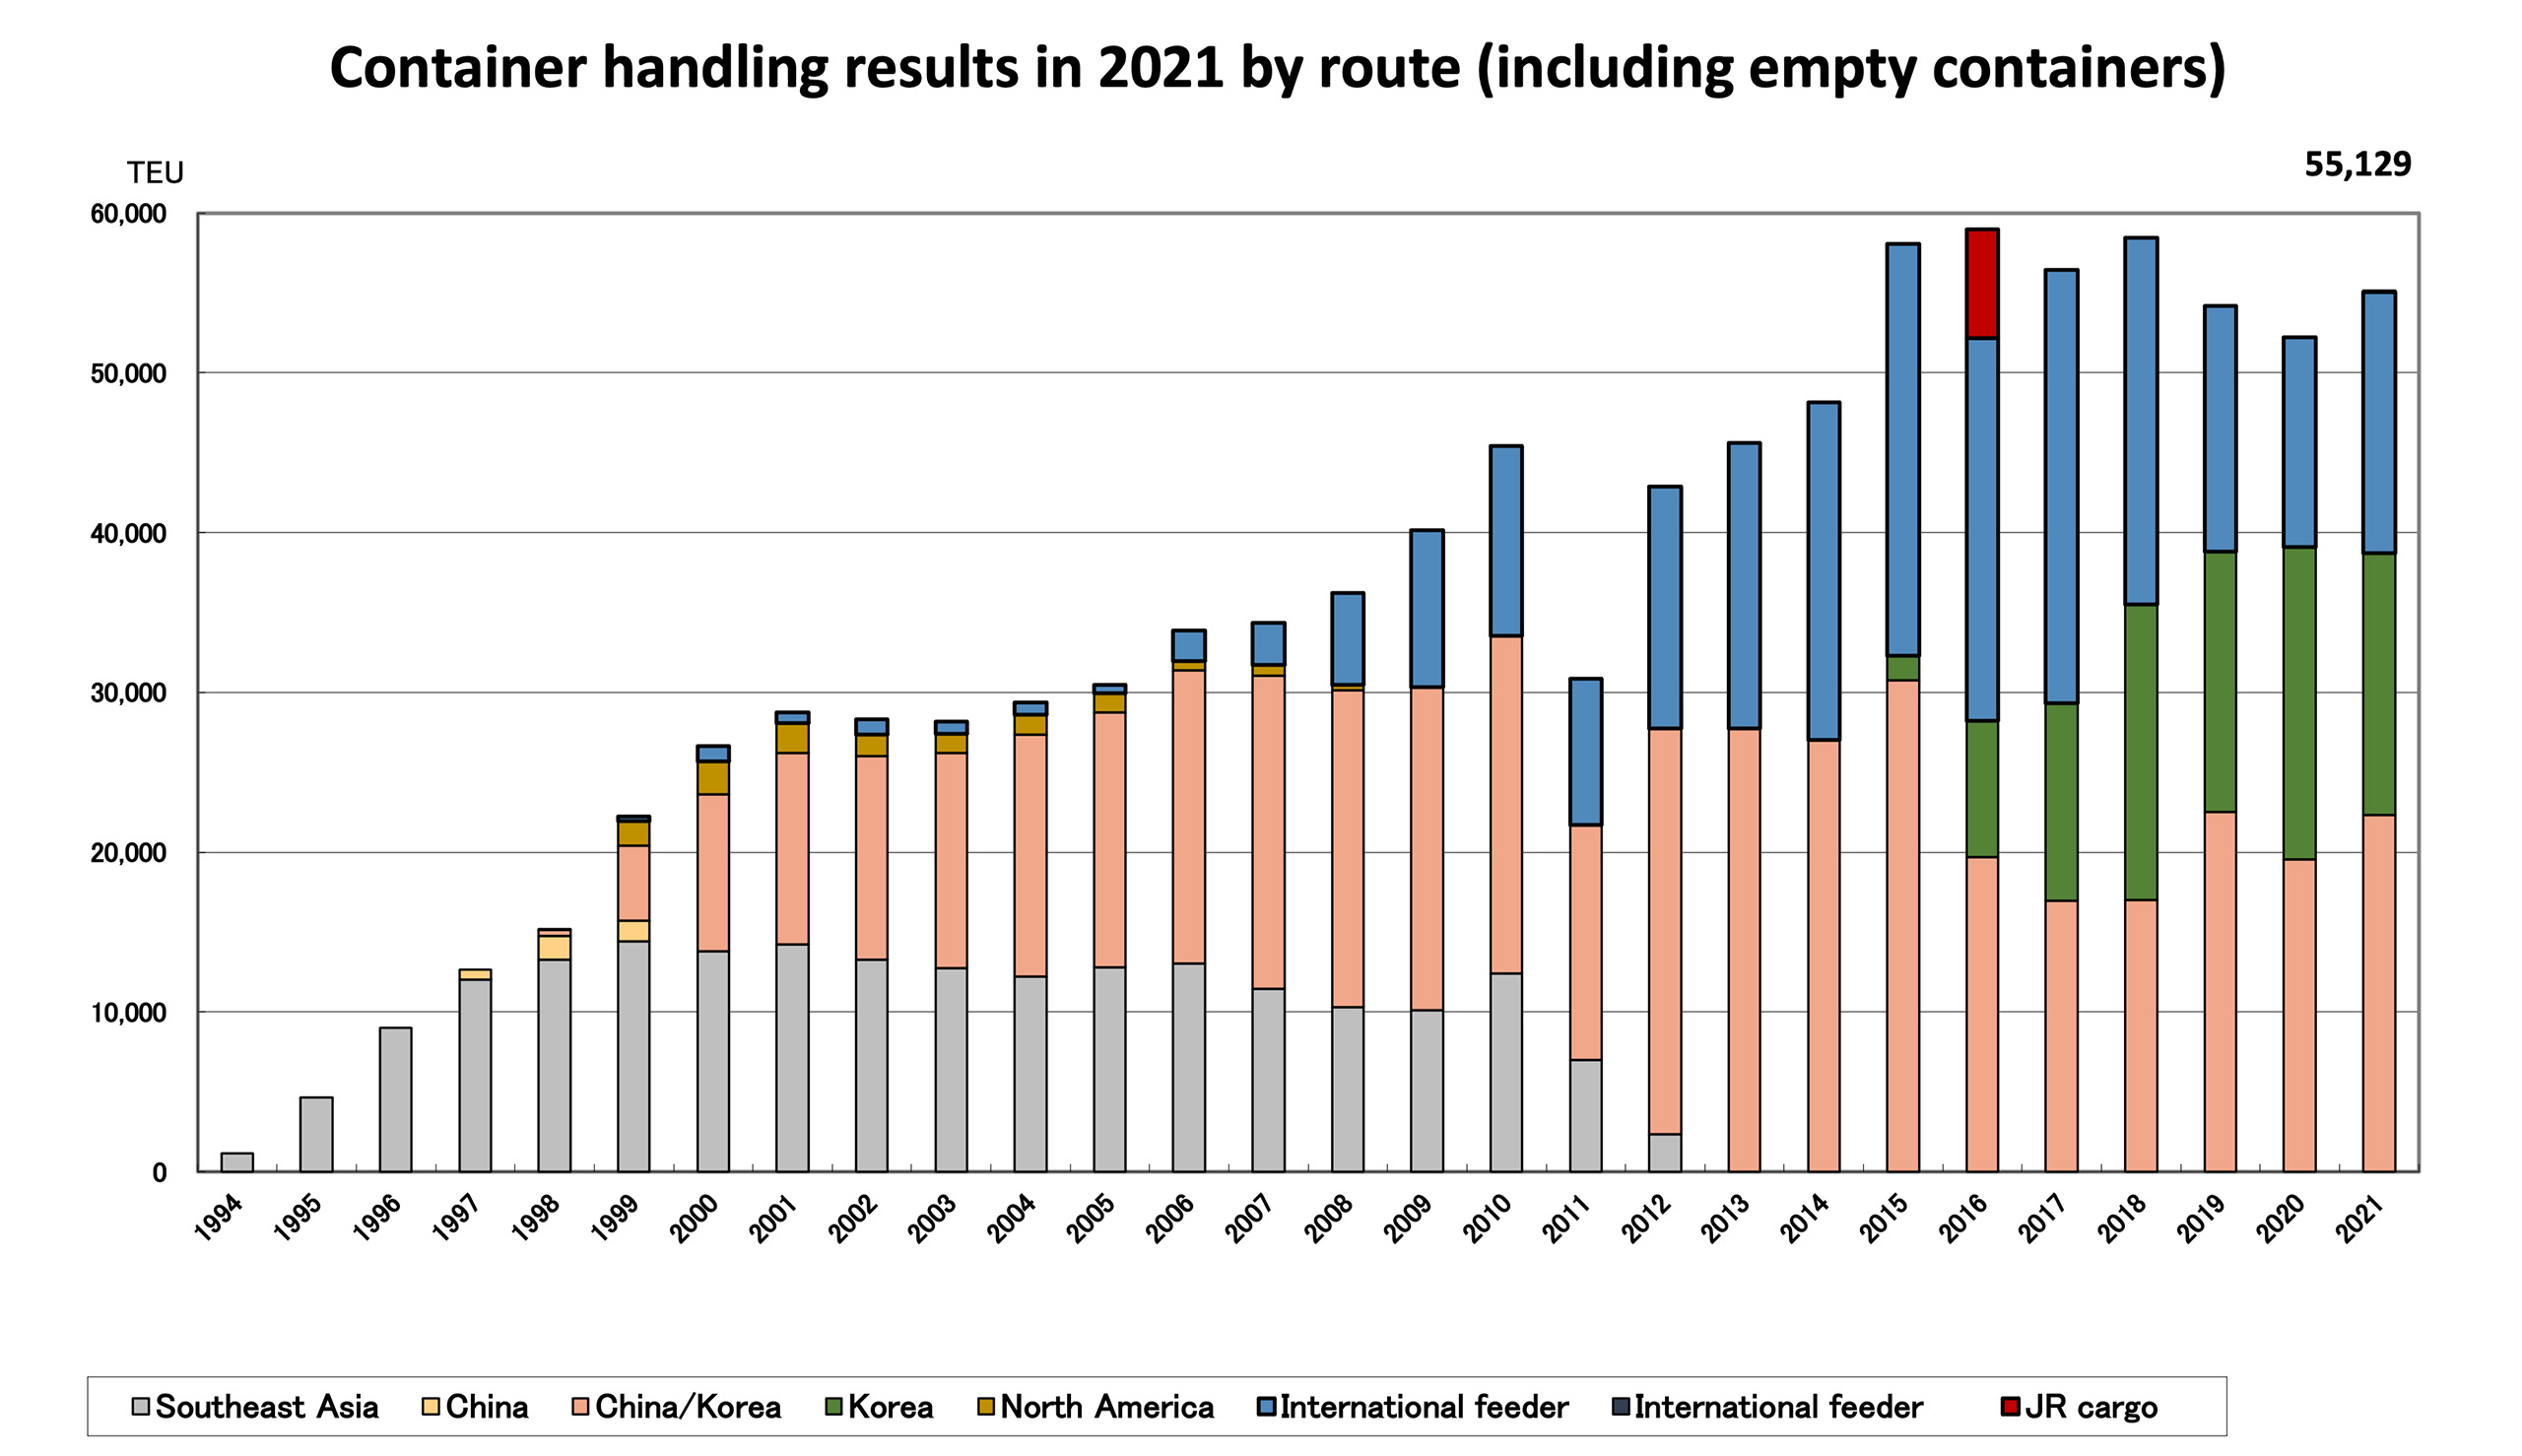
| Southeast Asia | China | China/Korea | Korea | North America | International feeder | JR cargo | Total | YoY comparison | |
|---|---|---|---|---|---|---|---|---|---|
| 1994 | 1,152 | 1,152 | |||||||
| 1995 | 4,678 | 4,678 | 406% | ||||||
| 1996 | 8,999 | 8,999 | 192% | ||||||
| 1997 | 12,039 | 632 | 12,671 | 141% | |||||
| 1998 | 13,280 | 1,484 | 374 | 43 | 15,181 | 120% | |||
| 1999 | 14,413 | 1,289 | 4,709 | 1,554 | 284 | 22,249 | 147% | ||
| 2000 | 13,826 | - | 9,783 | 2,064 | 972 | 26,645 | 120% | ||
| 2001 | 14,247 | - | 11,967 | 1,880 | 654 | 28,748 | 108% | ||
| 2002 | 13,271 | - | 12,767 | 1,309 | 982 | 28,329 | 99% | ||
| 2003 | 12,742 | - | 13,486 | 1,204 | 751 | 28,183 | 99% | ||
| 2004 | 12,225 | - | 15,158 | 1,246 | 736 | 29,365 | 104% | ||
| 2005 | 12,803 | - | 15,975 | 1,166 | 553 | 30,497 | 104% | ||
| 2006 | 13,056 | - | 18,337 | 560 | 1,951 | 33,904 | 111% | ||
| 2007 | 11,472 | - | 19,595 | 673 | 2,611 | 34,351 | 101% | ||
| 2008 | 10,312 | - | 19,854 | 309 | 5,766 | 36,241 | 106% | ||
| 2009 | 10,123 | - | 20,210 | 0 | 9,828 | 40,161 | 111% | ||
| 2010 | 12,434 | - | 21,124 | 0 | 11,872 | 45,430 | 113% | ||
| 2011 | 7,004 | - | 14,708 | 0 | 9,134 | 30,846 | 68% | ||
| 2012 | 2,379 | - | 25,350 | 0 | 15,134 | 42,863 | 139% | ||
| 2013 | - | - | 27,737 | 0 | 17,899 | 45,636 | 106% | ||
| 2014 | - | - | 27,022 | 0 | 21,114 | 48,136 | 105% | ||
| 2015 | - | - | 30,789 | 1,509 | 0 | 25,767 | 58,065 | 121% | |
| 2016 | - | - | 19,708 | 8,503 | 0 | 23,952 | 6,809 | 58,972 | 102% |
| 2017 | - | - | 16,976 | 12,360 | 0 | 27,093 | 56,429 | 96% | |
| 2018 | - | - | 17,038 | 18,465 | 0 | 22,960 | 58,463 | 104% | |
| 2019 | - | - | 22,546 | 16,273 | 0 | 15,359 | 54,178 | 93% | |
| 2020 | - | - | 19,568 | 19,540 | 0 | 13,124 | 52,232 | 96% | |
| 2021 | - | - | 22,358 | 16,338 | 0 | 16,358 | 75 | 55,129 | 106% |
*0: Suspended route
*One container (12 feet) of JR cargo is counted as 0.6 TEU.
Container handling results by route (excluding empty containers) (2021)
Author: Hachinohe Port Logistics Globalization Promotion Council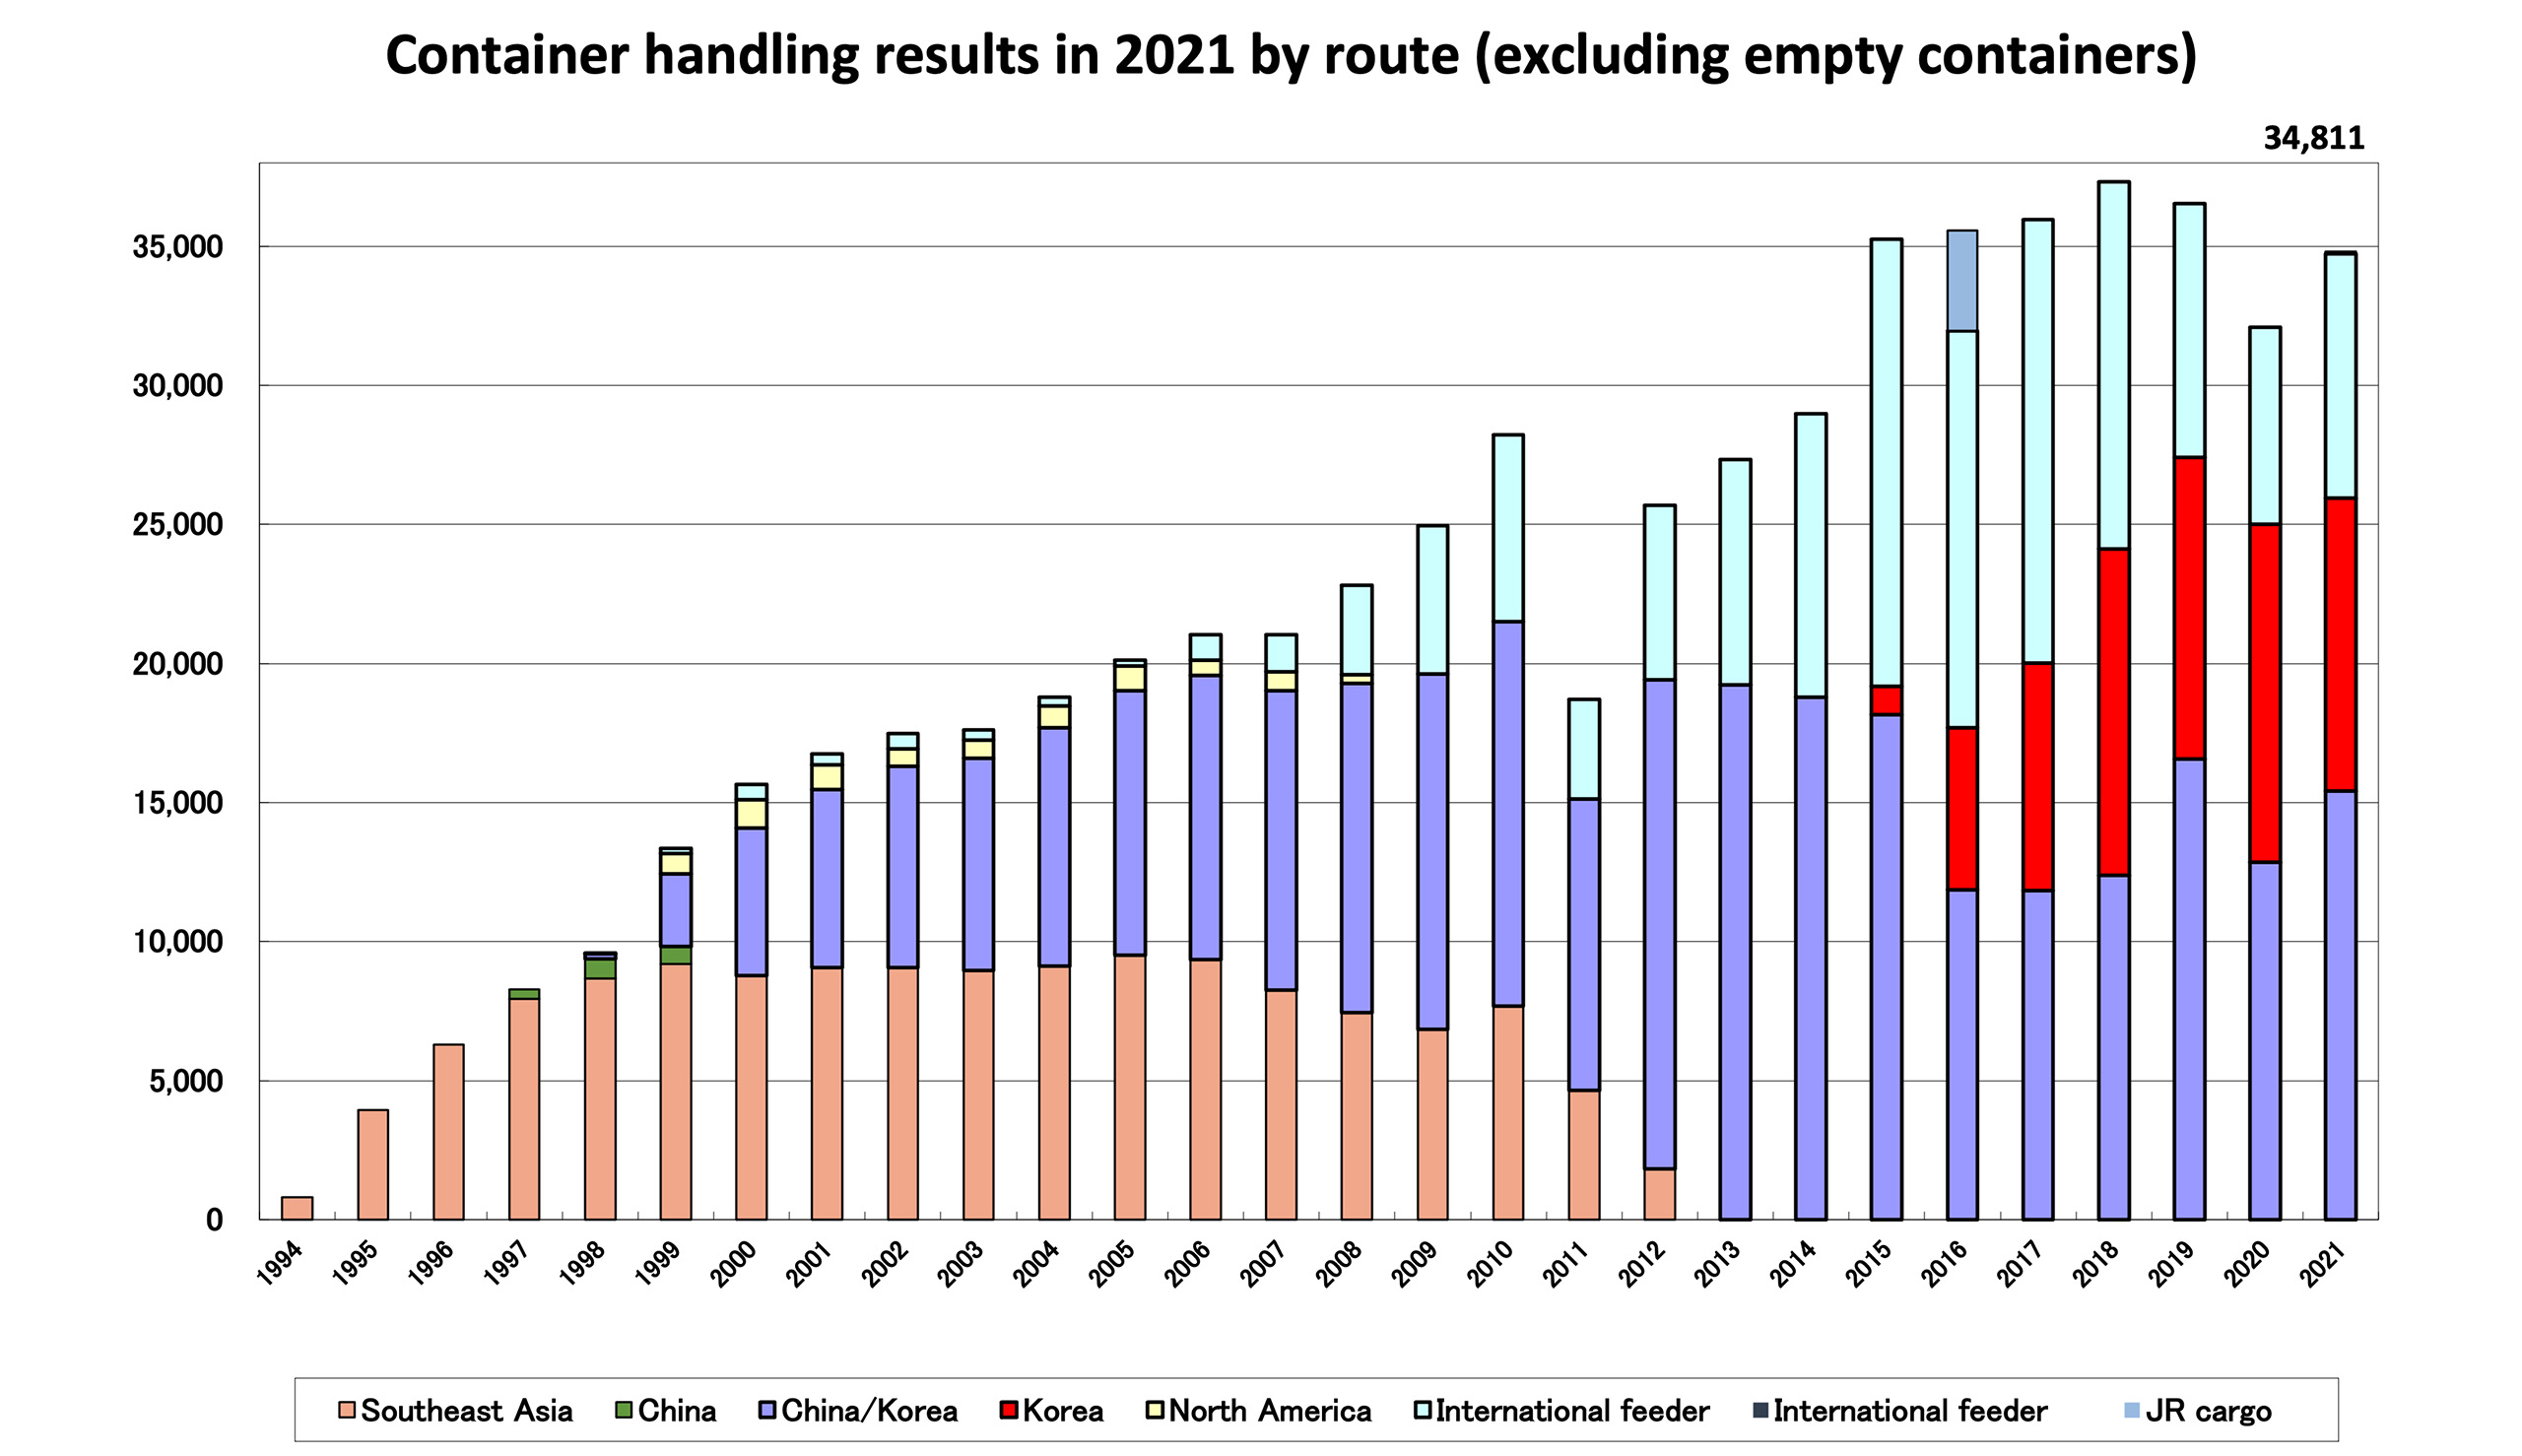
| Southeast Asia | China | China/Korea | Korea | North America | International feeder | JR cargo | Totals | YoY comparison | |
|---|---|---|---|---|---|---|---|---|---|
| 1994 | 797 | 797 | |||||||
| 1995 | 3,952 | 3,952 | 496% | ||||||
| 1996 | 6,302 | 6,302 | 159% | ||||||
| 1997 | 7,951 | 334 | 8,285 | 131% | |||||
| 1998 | 8,687 | 686 | 187 | 35 | 9,595 | 116% | |||
| 1999 | 9,198 | 632 | 2,611 | 732 | 173 | 13,346 | 139% | ||
| 2000 | 8,791 | - | 5,302 | 1,007 | 552 | 15,652 | 117% | ||
| 2001 | 9,078 | - | 6,393 | 890 | 393 | 16,754 | 107% | ||
| 2002 | 9,076 | - | 7,223 | 632 | 546 | 17,477 | 104% | ||
| 2003 | 8,970 | - | 7,628 | 640 | 375 | 17,613 | 101% | ||
| 2004 | 9,127 | - | 8,572 | 780 | 302 | 18,781 | 107% | ||
| 2005 | 9,504 | - | 9,520 | 890 | 218 | 20,132 | 107% | ||
| 2006 | 9,356 | - | 10,218 | 536 | 932 | 21,042 | 105% | ||
| 2007 | 8,257 | - | 10,777 | 673 | 1,331 | 21,038 | 100% | ||
| 2008 | 7,445 | - | 11,840 | 309 | 3,212 | 22,806 | 108% | ||
| 2009 | 6,844 | - | 12,793 | 0 | 5,333 | 24,970 | 109% | ||
| 2010 | 7,684 | - | 13,829 | 0 | 6,704 | 28,217 | 113% | ||
| 2011 | 4,650 | - | 10,481 | 0 | 3,570 | 18,701 | 66% | ||
| 2012 | 1,817 | - | 17,608 | 0 | 6,256 | 25,681 | 137% | ||
| 2013 | - | - | 19,245 | 0 | 8,088 | 27,333 | 106% | ||
| 2014 | - | - | 18,785 | 0 | 10,188 | 28,973 | 106% | ||
| 2015 | - | - | 18,157 | 1,026 | 0 | 16,075 | 35,258 | 123% | |
| 2016 | - | - | 11,871 | 5,817 | 0 | 14,265 | 3,628 | 35,581 | 101% |
| 2017 | - | - | 11,842 | 8,168 | 0 | 15,939 | 35,949 | 101% | |
| 2018 | - | - | 12,398 | 11,728 | 0 | 13,196 | 37,322 | 104% | |
| 2019 | - | - | 16,559 | 10,863 | 0 | 9,104 | 36,526 | 98% | |
| 2020 | - | - | 12,853 | 12,146 | 0 | 7,103 | 32,102 | 88% | |
| 2021 | - | - | 15,418 | 10,526 | 0 | 8,792 | 75 | 34,811 | 108% |
*0: Suspended route
*One container (12 feet) of JR cargo is counted as 0.6 TEU.
Container handling at Hachinohe Port by year (excluding empty containers)
Author: Hachinohe Port Logistics Globalization Promotion Council Unit: TEU| Export | Import | Outbound | Inbound | Total | YoY comparison | |
|---|---|---|---|---|---|---|
| 1994 | 488 | 309 | 797 | |||
| 1995 | 1,674 | 2,278 | 3,952 | 496% | ||
| 1996 | 2,496 | 3,806 | 6,302 | 159% | ||
| 1997 | 3,437 | 4,848 | 8,285 | 131% | ||
| 1998 | 3,997 | 5,598 | 9,595 | 116% | ||
| 1999 | 5,716 | 7,457 | 28 | 145 | 13,346 | 139% |
| 2000 | 5,964 | 9,136 | 70 | 482 | 15,652 | 117% |
| 2001 | 6,888 | 9,473 | 60 | 333 | 16,754 | 107% |
| 2002 | 6,937 | 9,994 | 81 | 465 | 17,477 | 104% |
| 2003 | 6,645 | 10,593 | 15 | 360 | 17,613 | 101% |
| 2004 | 7,086 | 11,393 | 27 | 275 | 18,781 | 107% |
| 2005 | 7,802 | 12,112 | 11 | 207 | 20,132 | 107% |
| 2006 | 7,202 | 12,908 | 804 | 128 | 21,042 | 105% |
| 2007 | 6,669 | 13,038 | 1,284 | 47 | 21,038 | 100% |
| 2008 | 6,352 | 13,242 | 2,539 | 673 | 22,806 | 108% |
| 2009 | 9,440 | 10,197 | 2,568 | 2,765 | 24,970 | 109% |
| 2010 | 11,533 | 9,980 | 2,835 | 3,869 | 28,217 | 113% |
| 2011 | 7,265 | 7,866 | 2,677 | 893 | 18,701 | 66% |
| 2012 | 9,408 | 10,017 | 4,470 | 1,786 | 25,681 | 137% |
| 2013 | 9,580 | 9,665 | 6,097 | 1,991 | 27,333 | 106% |
| 2014 | 7,922 | 10,863 | 7,111 | 3,077 | 28,642 | 105% |
| 2015 | 8,394 | 10,789 | 9,854 | 6,221 | 35,258 | 123% |
| 2016 | 7,820 | 9,868 | 9,852 | 8,041 | 35,581 | 101% |
| 2017 | 9,177 | 10,833 | 11,357 | 4,582 | 35,949 | 101% |
| 2018 | 11,112 | 13,014 | 9,173 | 4,023 | 37,322 | 104% |
| 2019 | 12,048 | 15,374 | 6,292 | 2,812 | 36,526 | 98% |
| 2020 | 10,722 | 14,277 | 4,034 | 3,069 | 32,102 | 88% |
| 2021 | 9,705 | 16,239 | 5,610 | 3,257 | 34,811 | 108% |
Container handling by product (2021)
Author: Hachinohe Port Logistics Globalization Promotion Council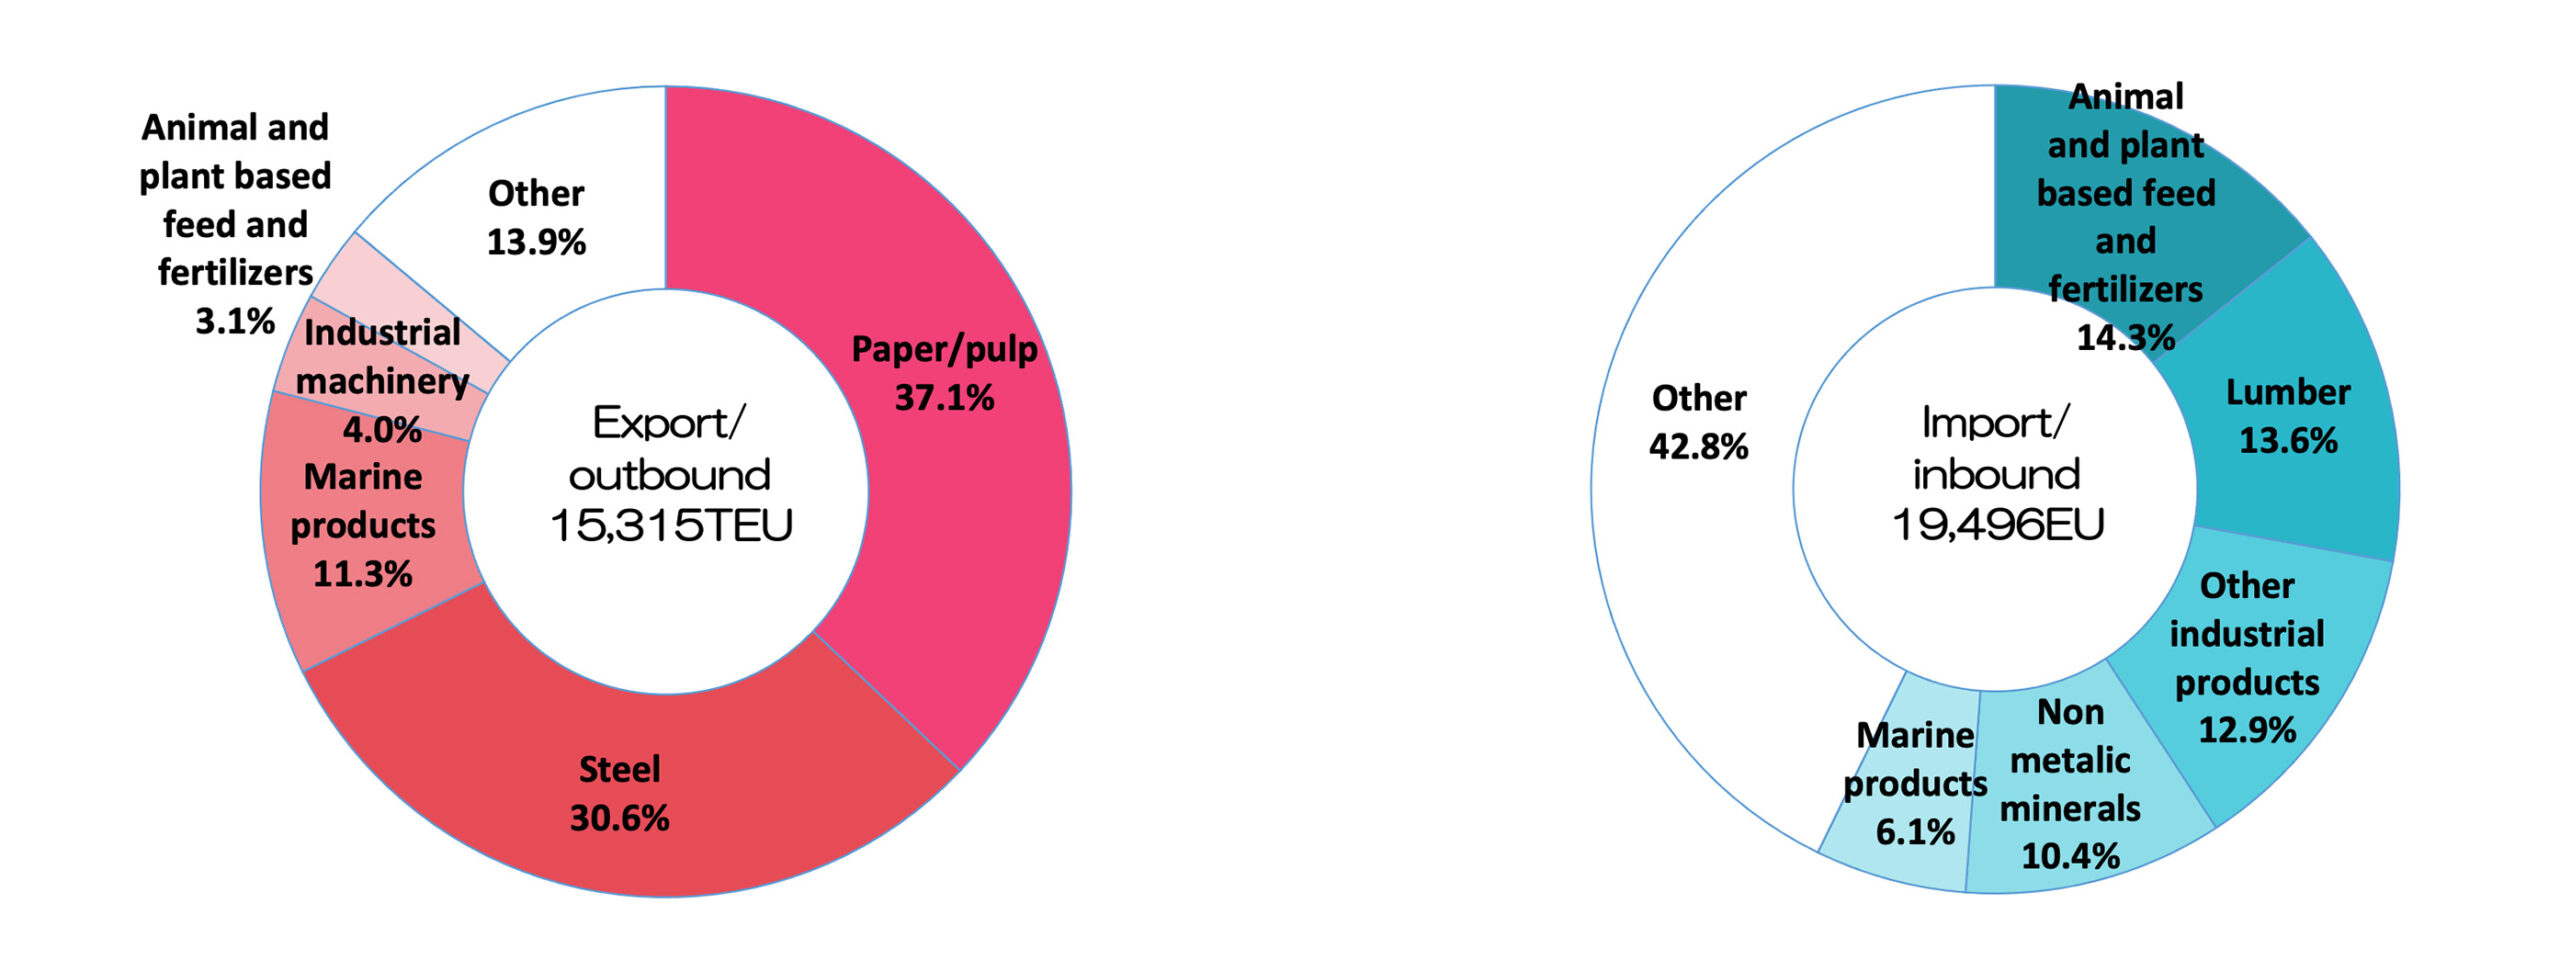
Container handling by country (2021)
Author: Hachinohe Port Logistics Globalization Promotion Council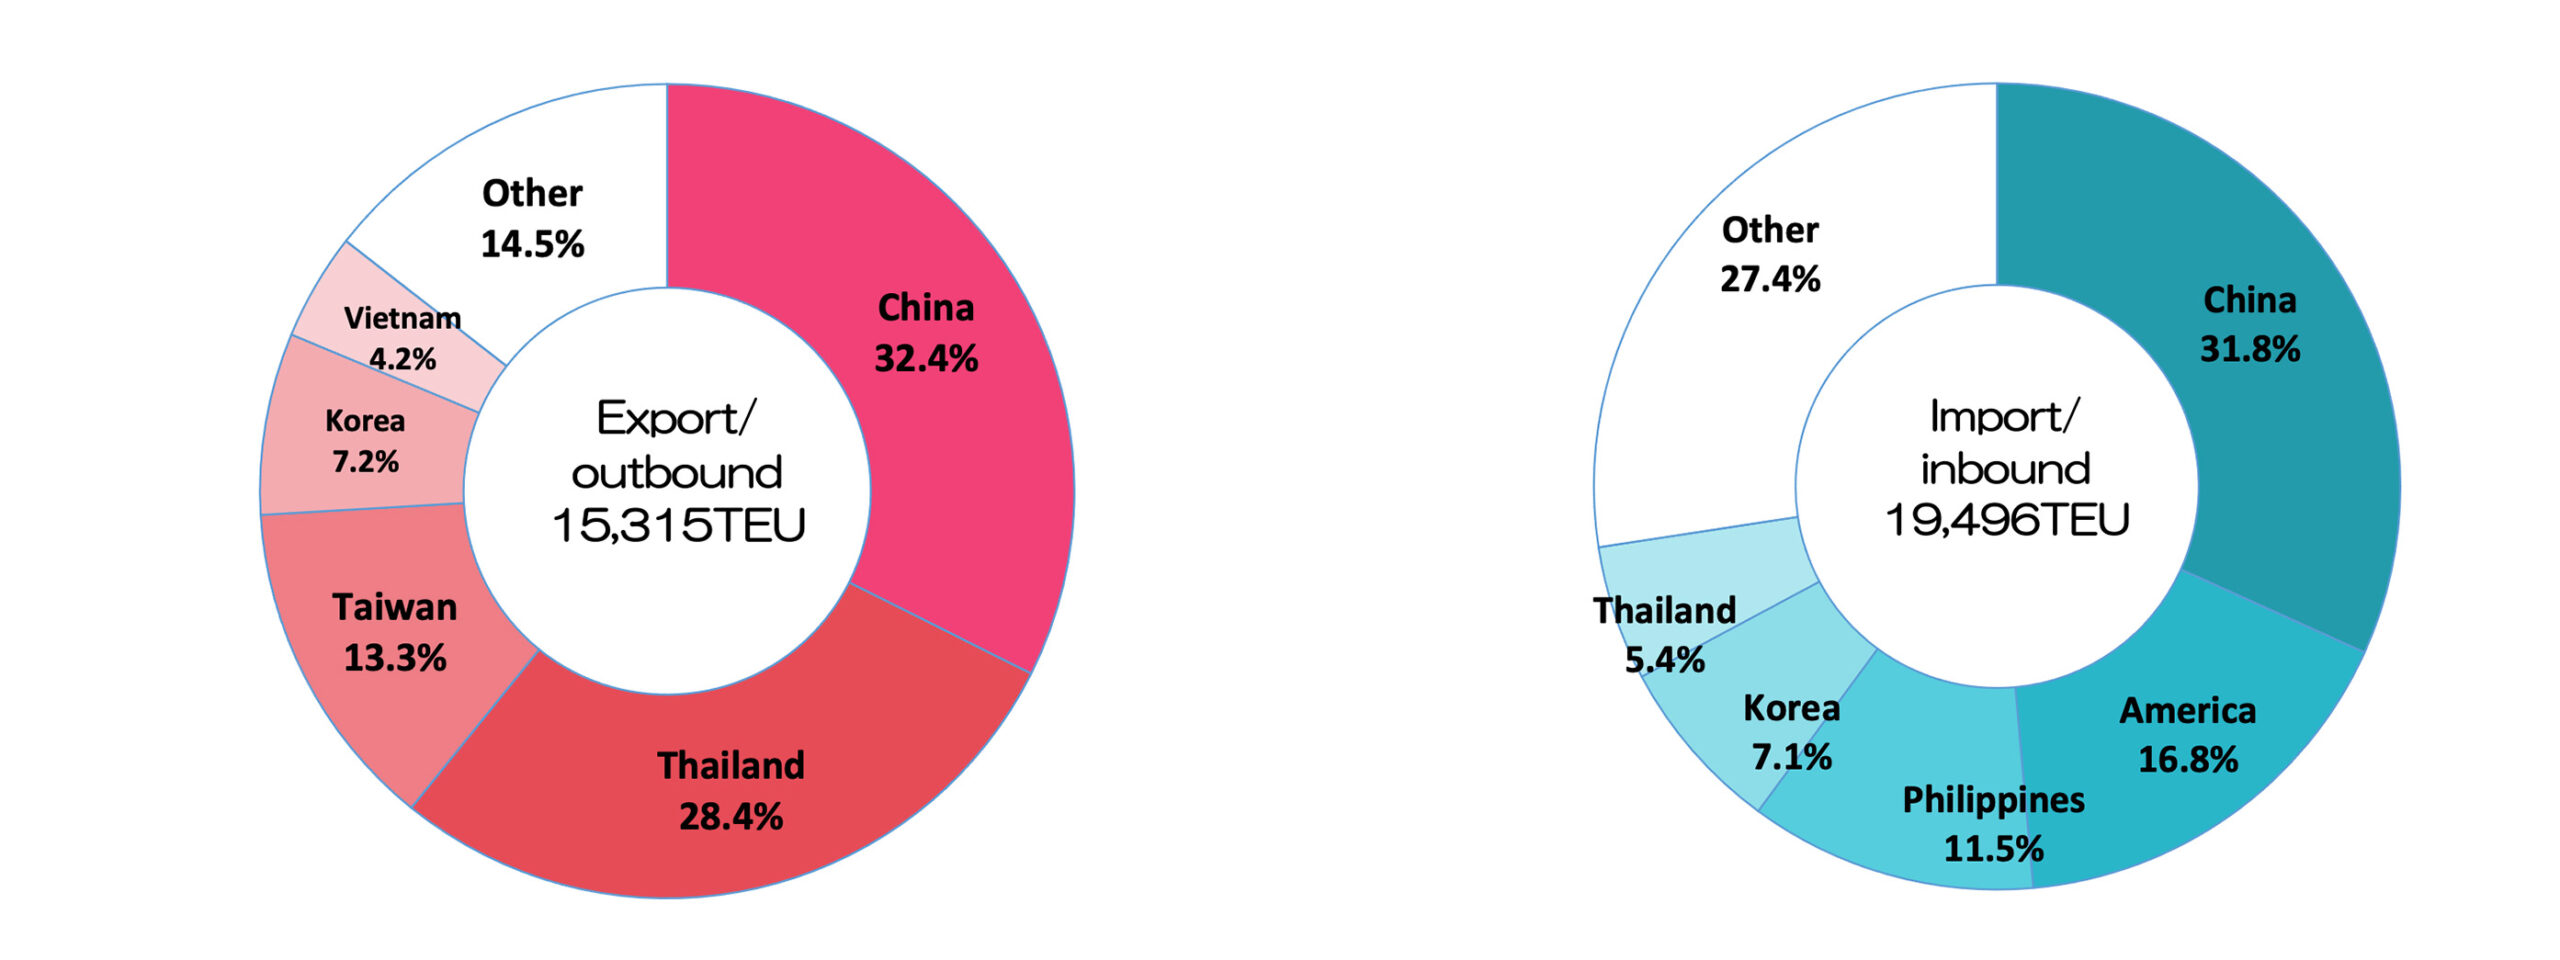
*Percentages may not add up to 100% due to rounding.
